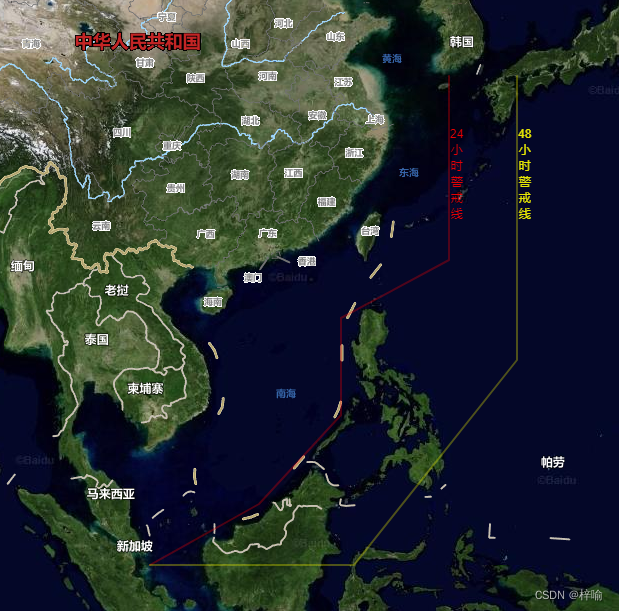
百度地图画24h和48h台风警戒线
首先,感谢 百度地图API1. 台风警戒线坐标//警戒线坐标数据let earlyWarnLine = [{key: 24,name: '小时警戒线',color: 'red',list: [[105, 0],[113, 4.5],[119, 11],[119, 18],[127, 22],[127, 34]]},{
·
首先,感谢 百度地图API
1. 台风警戒线坐标
//  警戒线坐标数据
let earlyWarnLine = [{
    key: 24,
    name: '小时警戒线',
    color: 'red',
    list: [
        [105, 0],
        [113, 4.5],
        [119, 11],
        [119, 18],
        [127, 22],
        [127, 34]
    ]
},
{
    key: 48,
    name: '小时警戒线',
    color: 'yellow',
    list: [
        [105, 0],
        [120, 0],
        [132, 15],
        [132, 34]
    ]
}];
2. 画台风警戒线
	drawGuardLine();

    //  画警戒线
    function drawGuardLine(guardLineList) {
        earlyWarnLine .forEach(item => {
            //  以坐标点划线
            let list = item.list;
            let polylinepts = [];
            let listLength = list.length;
            let polylineOptions = {
                strokeColor: item.color,
                strokeWeight: 2,
                strokeOpacity: 0.3
            }

            list.forEach(each => {
            	//	画地图所需的点实例
                polylinepts.push(new BMap.Point(...each));
            });
            //	将点实例做成线实例
            polyline = new BMap.Polyline(polylinepts, polylineOptions);
            polyline.enableMassClear();	//	允许清除线
            map.addOverlay(polyline);	//	将生成的线实例画到地图上

			//	警戒线名称也要画到地图
            let html = item.name;
            html = item.key + "<br>" + html.split('').join("<br>");
            let label = new BMap.Label(html, {
                position: polylinepts[polylinepts.length - 1],
                offset: new BMap.Size(0, 50)
            })
            label.setStyle({
                color: item.color,
                textAlign: 'center',
                border: "none",
                fontSize: "12px",
                backgroundColor: "transparent",
                opacity: 0.9
            });
            map.addOverlay(label);
        });
    }
结果
参考实例
Point (lng: Number, lat: Number) 以指定的经度和纬度创建一个地理点坐标
Polyline (points: Array< Point >, opts: PolylineOptions ) 创建折线覆盖物对象
Label (content: String, opts: LabelOptions) 创建一个文本标注实例。point参数指定了文本标注所在的地理位置

CSDN联合极客时间,共同打造面向开发者的精品内容学习社区,助力成长!
更多推荐


 2
2 0
0- 0


 已为社区贡献2条内容

所有评论(0)