python网格显示txt文件中xy坐标
·
1.txt文件中内容
1.1,2
2.1,2
3.1,3
4.1,5
40,38
42,41
43,42
2.python部分代码
#!/usr/bin/python
# coding: utf-8
import os
import re
import matplotlib.pyplot as plt
from numpy.random import rand

x_test = []
y_test = []
fig, ax = plt.subplots()

f = open("test.txt")  # 返回一个文件对象
line = f.readline()  # 调用文件的 readline()方法
while line:
    lineout=re.split('[,]+',line.strip())
    x_test.append(float(lineout[0]))
    y_test.append(float(lineout[1]))
    line = f.readline()

f.close()

for color in ['red']:
    scale = 200.0
    ax.scatter(x_test, y_test, c=color, s=scale, label=color,
               alpha=0.3, edgecolors='none')

ax.legend()
ax.grid(True)

plt.show()
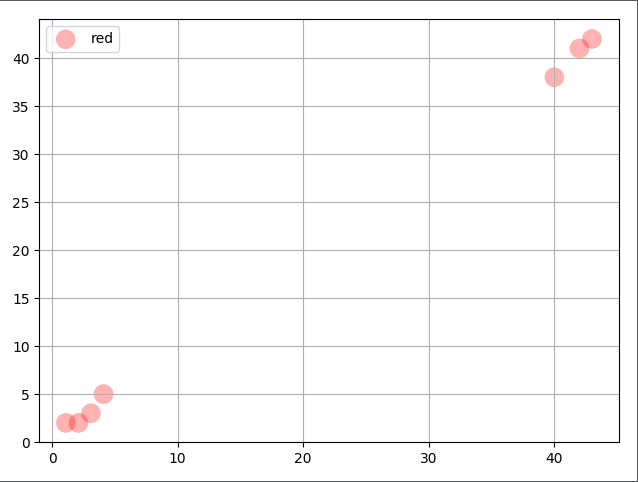
3.执行结果

CSDN联合极客时间,共同打造面向开发者的精品内容学习社区,助力成长!
更多推荐


 0
0 0
0- 0


 已为社区贡献7条内容

所有评论(0)