基于平均不同分辨率的共振峰跟踪算法matlab仿真
共振峰信息包含在语音信号的频谱包络中,谱包络的峰值基本对应于共振峰频率,因此一切共振峰估计都是直接或间接地从频谱包络进行考察,关键是估计语音频谱包络。共振峰轨迹的自动跟踪算法,其特点是不借助于其它的信息来源,仅仅是基于语谱图信息,来确定语谱图上前四个共振峰频率的位置和它们关于时间轴的轨迹.算法由三个层面构成;改变共振峰可以产生所有的原音和某些辅音,在共振峰中也包含辅音的重要信息。人在语音感知中也利
目录
1.算法描述
共振峰轨迹的自动跟踪算法,其特点是不借助于其它的信息来源,仅仅是基于语谱图信息,来确定语谱图上前四个共振峰频率的位置和它们关于时间轴的轨迹.算法由三个层面构成;第一层面是进行频率分布的分析,以决定一个最佳的共振峰搜索起始位置;第二层面是采用双搜索算法,来跟踪随时间变化的共振峰轨迹;第三层面是解决某些冲突现象.
在语音声学中,人声也同样受自身生理如鼻孔、咽腔、口腔大小的影响有自身的共振峰区。通过利用这些共鸣空间的形状和大小不同的变化(例如改变咽喉、嘴形),我们就能改变声音的共振峰。我们之所以能够区分不同的人声、元音,主要也是依靠它们的共振峰分布的位置。
共振峰反映了声道谐振特性的重要特点,它代表了发音信息的最直接的来源。改变共振峰可以产生所有的原音和某些辅音,在共振峰中也包含辅音的重要信息。人在语音感知中也利用了共振峰信息,所以共振峰已经广泛应用于语音识别的主要特征和语音编码传输的基本信息。
一个语音的共振峰模型,只用前三个时变共振峰频率就可以得到可懂度很好的合成浊音。共振峰信息包含在语音信号的频谱包络中,谱包络的峰值基本对应于共振峰频率,因此一切共振峰估计都是直接或间接地从频谱包络进行考察,关键是估计语音频谱包络。语音信号共振峰的估计,在语音信号合成、语音信号自动识别和低比特率语音信号传输等方面都起着重要作用。
语音信号从整体来看其特征及表征其本质特征的参数均是随时间而变化的,所以它是个非平稳态过程,不能用处理平稳信号的数字信号处理技术进行分析处理。但是在一个短的时间范围内(一般认为在10~30ms的短时间内),语音信号的特性基本保持相对稳定,因而可以将其看作一个准稳态过程,即语音信号具有短时平稳性。
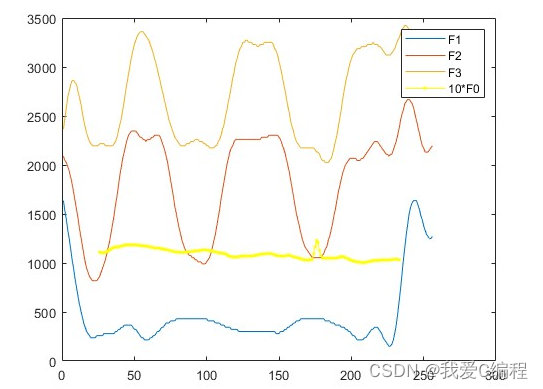
2.仿真效果预览
matlab2022a仿真结果如下:


3.MATLAB核心程序
function [fmap,pt2] = ftrack(y,fs)

bDisplay = 1;

Fsamps = 256; % sampling resolution in frequency dimension
Tsamps = round(length(y)/18000*256); % sampling resolution in time dimension


tmp_img1 = zeros(Fsamps,Tsamps);
ct = 0;

numiter = 8; % number of iterations to run. seemed like a good number


for i=2.^(8-8*exp(-linspace(1.5,10,numiter)/1.4)),
    % Determine the time-frequency distribution at the current

    fix(length(y)/round(i))
    round(i)
    [tmp_img1,ft1,pt1] = lpcsgram(y,fix(length(y)/round(i)),round(i),fs);

    % Get the dimensions of the output time-frequency image
    [M,N] = size(tmp_img1);

    % Create a grid of the final resolution
    [xi,yi] = meshgrid(linspace(1,N,Tsamps),linspace(1,M,Fsamps));

    % Interpolate returned TF image to final resolution
    tmp_img2 = interp2(tmp_img1,xi,yi);

    ct = ct+1;

    % Interpolate formant tracks and pitch tracks
    pt2(:,ct) = interp1([1:length(pt1)]',pt1(:),linspace(1,length(pt1),Tsamps)');
    ft2(:,:,ct) = interp1(linspace(1,length(y),fix(length(y)/round(i)))',Fsamps*ft1',linspace(1,length(y),Tsamps)')';

    % Normalize
    tmp_img3(:,:,ct) = tmp_img2/max(tmp_img2(:));

    if bDisplay,
        subplot(221);imagesc(tmp_img1);axis xy;
        subplot(222);imagesc(tmp_img2);axis xy;
        subplot(223);imagesc(squeeze(mean(tmp_img3,3)));axis xy;
        drawnow;
    end;
end

% Determine mean tfr image and formant track
tmp_img4 = squeeze(mean(tmp_img3,3));    % tfr
ft3 = squeeze(nanmean(permute(ft2,[3 2 1]))); %

if bDisplay,
    subplot(224);imagesc(tmp_img4);axis xy;
    hold on;
    plot(ft3,'y');
end;

% convert fmnts to image
tmap = repmat([1:Tsamps]',1,3);
idx = find(~isnan(sum(ft3,2)));
fmap = ft3(idx,:);
tmap = tmap(idx,:);
% filter formant tracks to remove noise
[b,a] = butter(9,0.1);
fmap = round(filtfilt(b,a,fmap));
pt3 = nanmean(pt2');
pt3 = (pt3-nanmin(pt3))/(nanmax(pt3)-nanmin(pt3));

% Rescaling is done after display code
if bDisplay,
    imap = zeros(Fsamps,Tsamps);
    ind = sub2ind(size(imap),fmap(:),tmap(:));
    imap(ind) = 1;

    tpts = tmap(:,1);

    figure;
    subplot(221);
    imagesc(imap);axis xy;hold on;
    plot(tpts,fmap(:,1),tpts,fmap(:,2),tpts,fmap(:,3));
    idx = [1:5]';
    plot(tpts(idx),fmap(idx,1),'.-',tpts(idx),fmap(idx,2),'.-',tpts(idx),fmap(idx,3),'.-');

    subplot(222);

    % Create a wider formant track
    anisomask = anisodiff(imap,6,50,0.01,1);

    imagesc(anisomask>0);axis xy;hold on;
    plot(tpts,fmap(:,1),tpts,fmap(:,2),tpts,fmap(:,3));
    idx = [1:5]';
    plot(tpts(idx),fmap(idx,1),'.-',tpts(idx),fmap(idx,2),'.-',tpts(idx),fmap(idx,3),'.-');

    subplot(223);
    imagesc(tmp_img4);axis xy;hold on;
    plot(tpts,fmap(:,1),'r',tpts,fmap(:,2),'r',tpts,fmap(:,3),'r');
    idx = [1:5]';
    plot(tpts(idx),fmap(idx,1),'.-',tpts(idx),fmap(idx,2),'.-',tpts(idx),fmap(idx,3),'.-');

    subplot(224);
    imagesc(tmp_img4.*(anisomask>0));axis xy;hold on;
    plot(tpts,fmap(:,1),'r-',tpts,fmap(:,2),'r-',tpts,fmap(:,3),'r-');
%    idx = [1:5]';
%    plot(tpts(idx),fmap(idx,1),'.-',tpts(idx),fmap(idx,2),'.-',tpts(idx),fmap(idx,3),'.-');
    plot(256*pt3,'y.-');
end;

% Rescale to Actual Formants and take the mean of pitch tracks
fmap = (fs/2)*(fmap/256);
pt2 = nanmean(pt2');
A112
4.完整MATLAB
V

CSDN联合极客时间,共同打造面向开发者的精品内容学习社区,助力成长!
更多推荐


 0
0 0
0- 0


 已为社区贡献4条内容

所有评论(0)